Introducing Signal: Real-time technical pattern detection

Today, we’re introducing Signal, an AI-powered service designed to detect and interpret critical technical formations in real-time market data. From the outset, Signal is built to integrate with third-party pricing APIs, supporting a wide range of financial instruments globally—equities, commodities, crypto assets, and more. Users can apply this technology across diverse markets and instruments, extending far beyond traditional stock charts.

Signal draws from an extensive body of literature on pattern detection and employs an iterative, machine-driven evaluation loop for continuous refinement. We benchmarked performance against 1,000,000 synthetic simulations, using LLMs not just to interpret results but to guide algorithmic adjustments automatically—at times even suggesting code-level modifications. This marks a new era where LLMs can serve as dynamic engineering assistants, refining detection logic without human oversight.
”For the first time, we’re seeing LLMs actively participating in the feedback cycle, providing not only critiques but also algorithmic changes. The models aren’t just advisors—they’re effectively co-engineers.” Luc Pettett, Founder & CEO
Capabilities
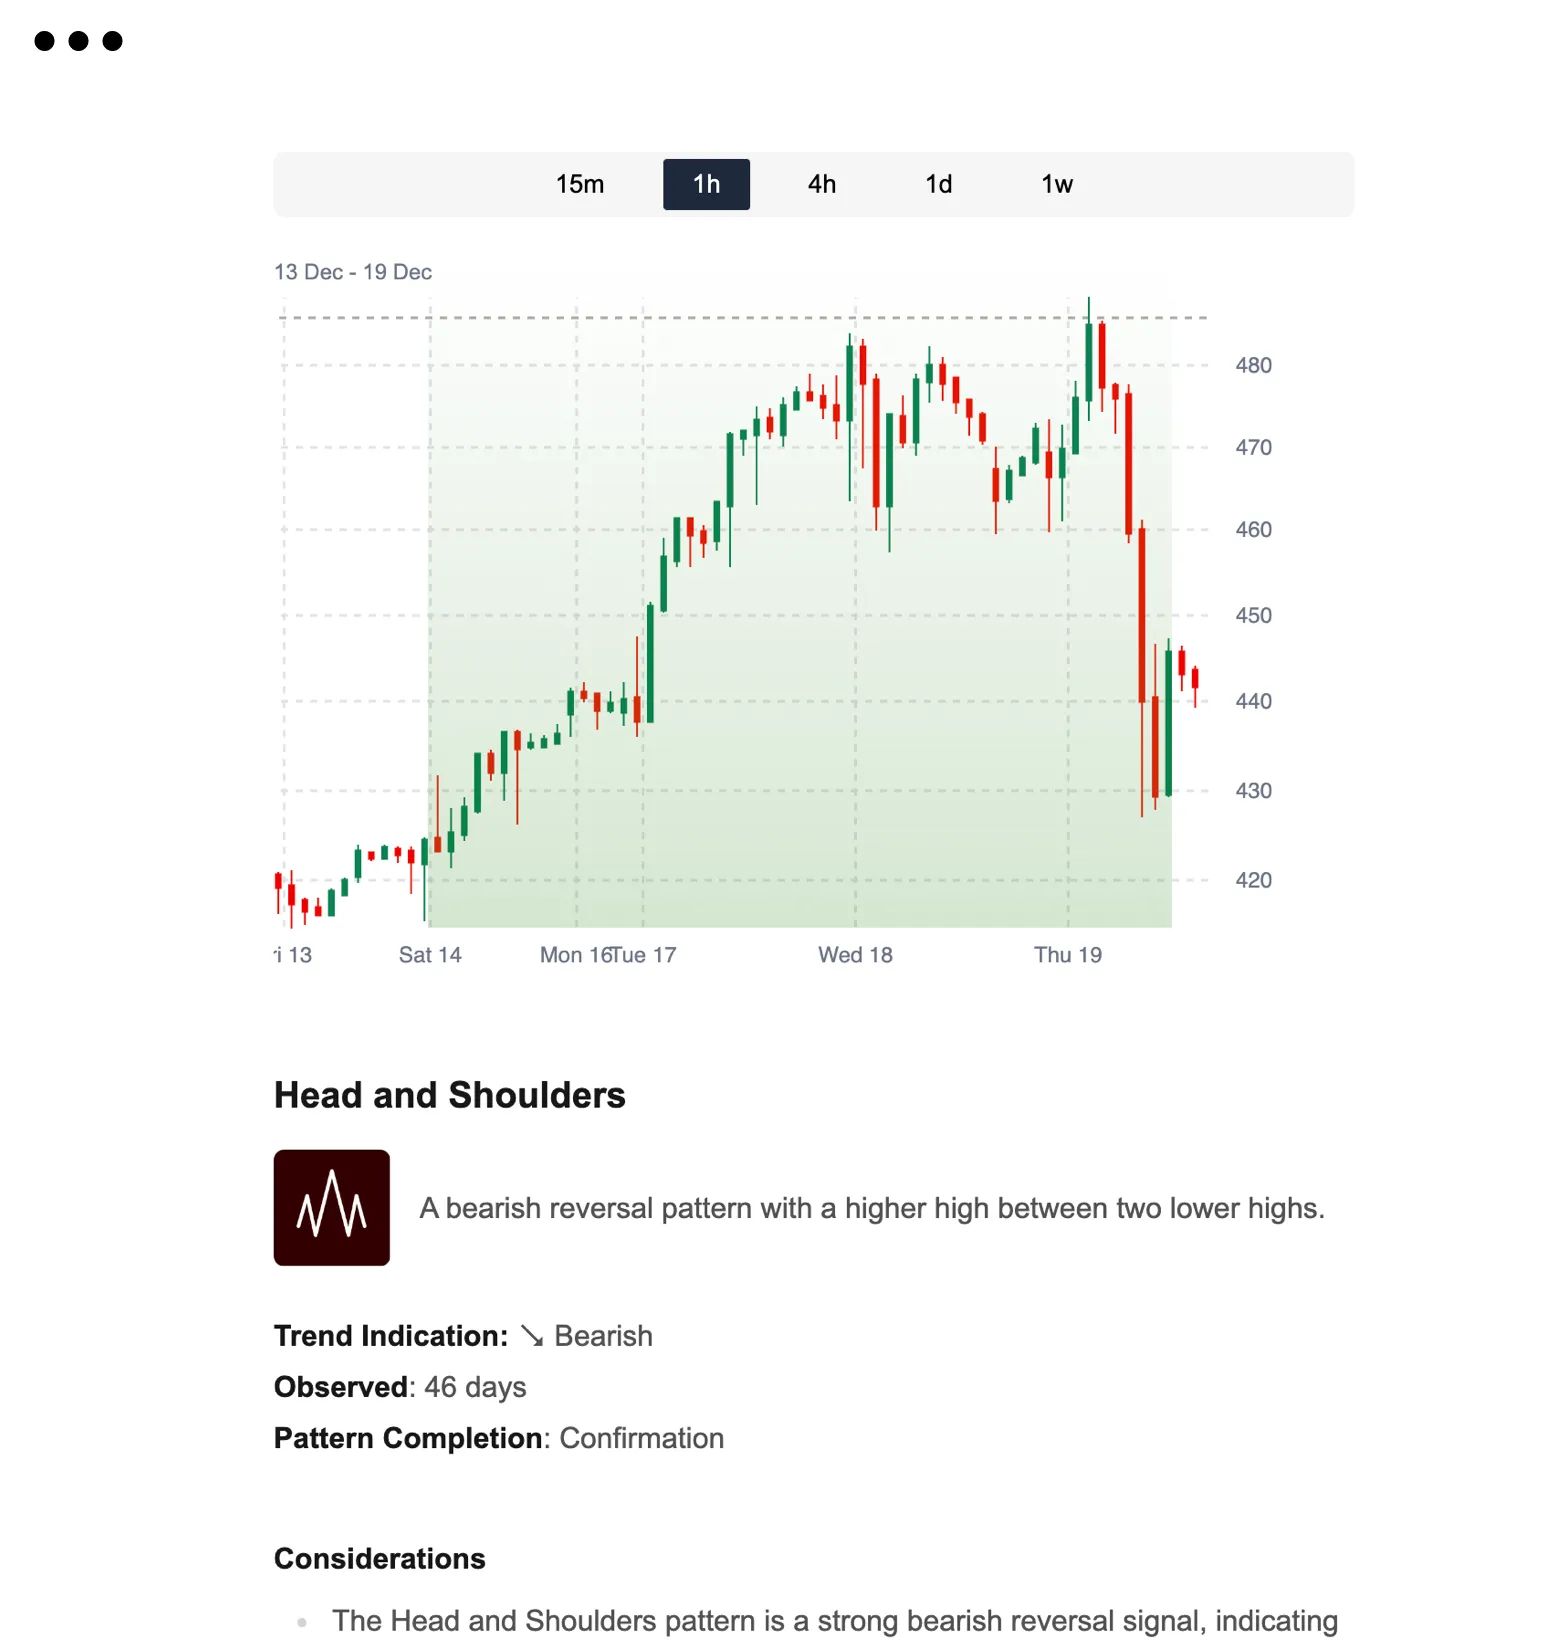
Signal detects over a dozen well-known formations, including head-and-shoulders, double bottoms, and various triangles and channels. Users can configure timeframes—such as 15-minute intervals—and specify exactly which patterns they want to track. With access to global pricing data, Signal can watch specific equities, commodity futures, crypto pairs, or any other instrument of interest.
Coming soon, we’ll introduce an indexing feature that lets traders monitor patterns across multiple assets with user-defined filters. For instance, a user could request to monitor a head-and-shoulders formation on 15-minute pricing intervals for a selection of stocks, commodities, or digital assets, all displayed in a centralized view.
Conversational insights
Signal also offers a conversational interface to help traders understand patterns without needing deep technical backgrounds. Through an AI-enabled chat session, users can discuss what the pattern signifies and clarify the factors influencing its development. Rather than simply presenting raw signals, Signal facilitates a two-way conversation that makes technical analysis more approachable.
In practice, this conversational layer explains why patterns matter, highlights potential catalysts, and compares newly formed patterns with past occurrences. By humanizing the data analysis process, Signal offers a more intuitive interface that brings traders closer to the insights they need.
To see the Telescope platform in action, contact our team for a live demo.